
Accounts payable cost & cycle benchmark
What does one invoice really cost you, and how far are you from best-in-class? We measure your full cost per invoice, cycle time, exception rate and touchless rate, then place you against the Ardent Partners 2025 market reference and best-in-class AP teams.
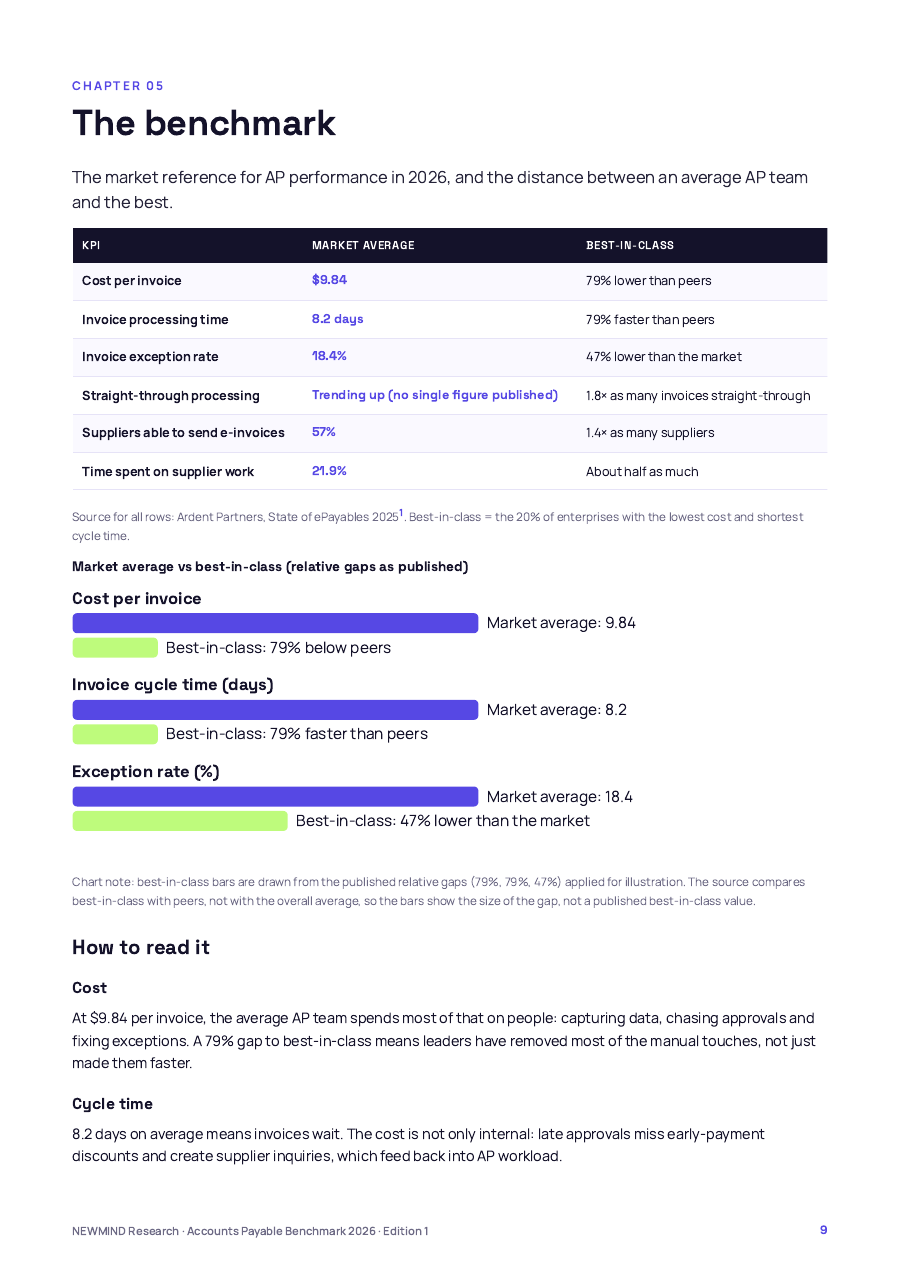
What the market looks like.
| KPI | Market reference | Best-in-class / note | Source |
|---|---|---|---|
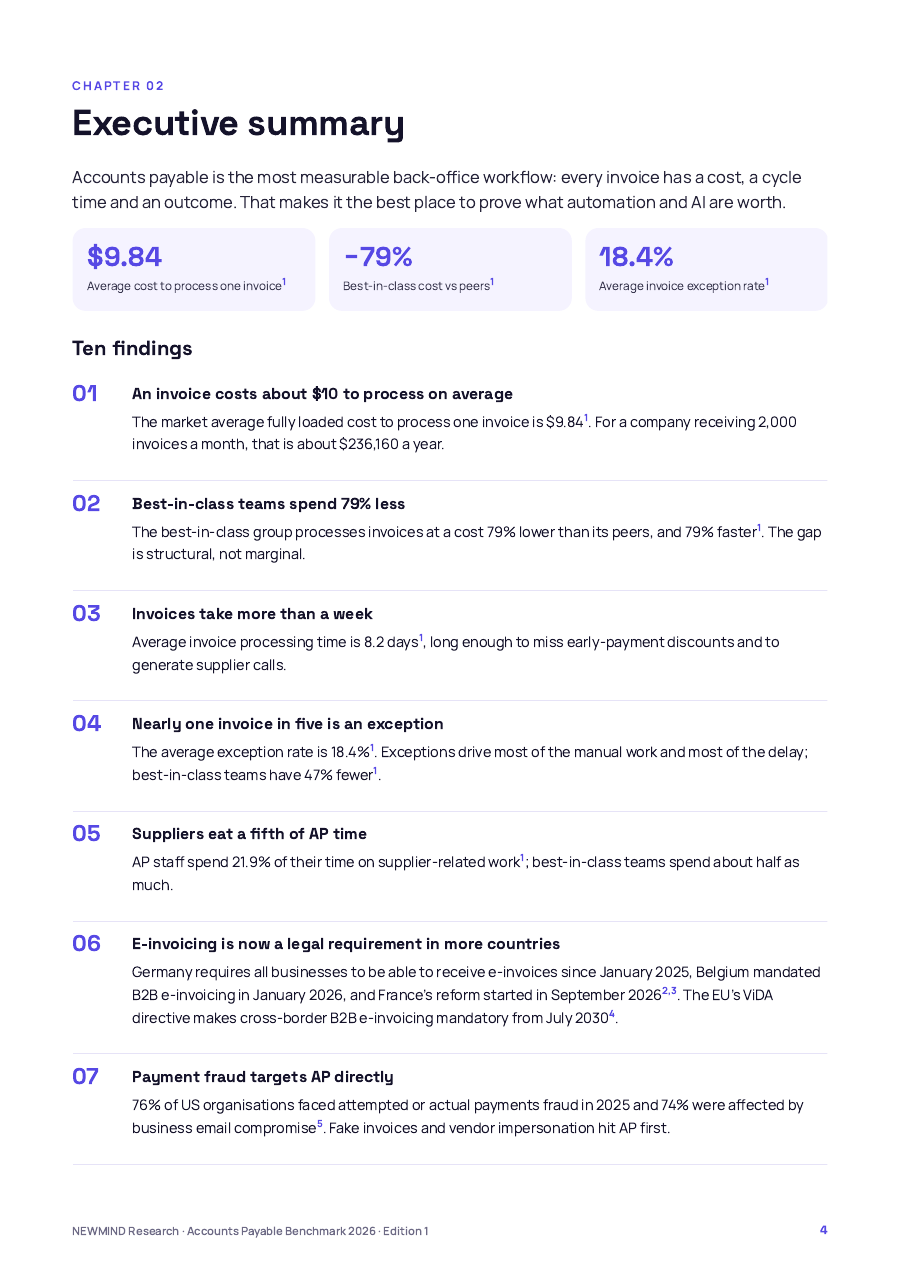
| Cost per invoice | $9.84 average | 79% lower than peers | 1 |
| Invoice cycle time | 8.2 days average | 79% faster than peers | 1 |
| Exception rate | 18.4% average | 47% lower than the market | 1 |
| Suppliers able to e-invoice | 57% average | 1.4× as many suppliers | 1 |
| Staff time on supplier inquiries | 21.9% average | About half as much | 1 |
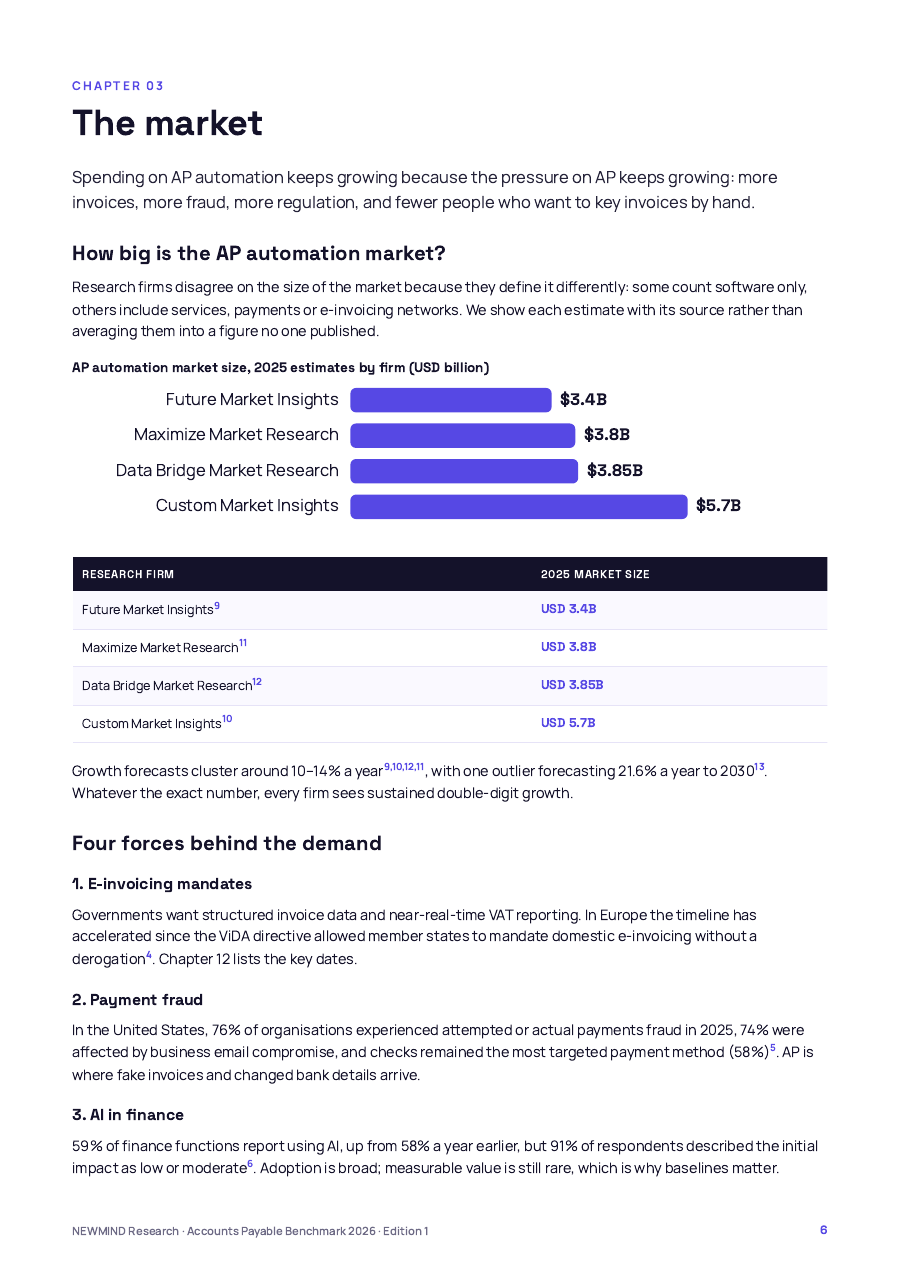
AP is the most measurable back-office workflow: every invoice has a cost, a cycle time and an outcome. Analysts size the AP automation market at USD 3.4–5.7 billion in 2025, growing 10–14% a year2,3, driven by cloud ERP and e-invoicing mandates.
Is this benchmark for you?
Industries
Manufacturing · Wholesale & distribution · Construction & real estate · Hospitality · Healthcare · Retail & e-commerce
Buyer
CFO & finance · COO & operations
Company profile
50+ employees
You need it if…
- More than 500 supplier invoices a month
- Invoices still keyed into the ERP by hand
- Late fees, duplicates or missed early-payment discounts
What we measure. What you get.
What we measure
- Fully loaded cost per invoice (people, tools, rework)
- Cycle time from receipt to approval and posting
- Exception rate by cause: price, quantity, missing PO, duplicate
- Touchless (straight-through) rate
- Early-payment discounts captured vs missed
What you receive
- Your position vs market average and best-in-class on every KPI
- Cost gap in dollars per year, per KPI
- Root causes of your top three exception types
- Costed automation roadmap with estimated integration weeks
Accounts Payable Cost & Cycle Benchmark 2026.
The full study behind this page: the market, the benchmark, the cost of the gap, how leaders close it, and the tools to act on it.
What’s included
Tools you can use straight away
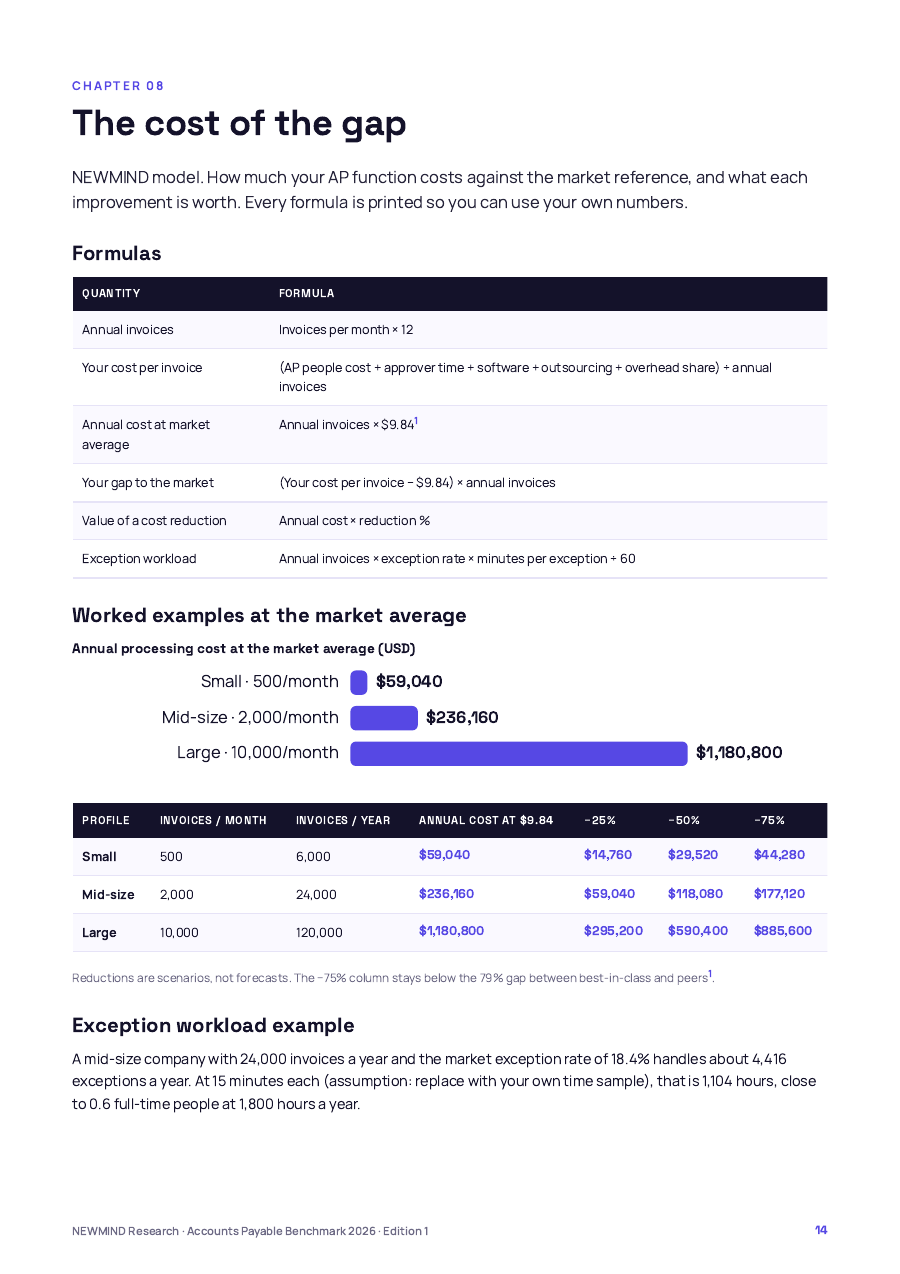
- Cost-of-the-gap model with worked examples
- Business-case template
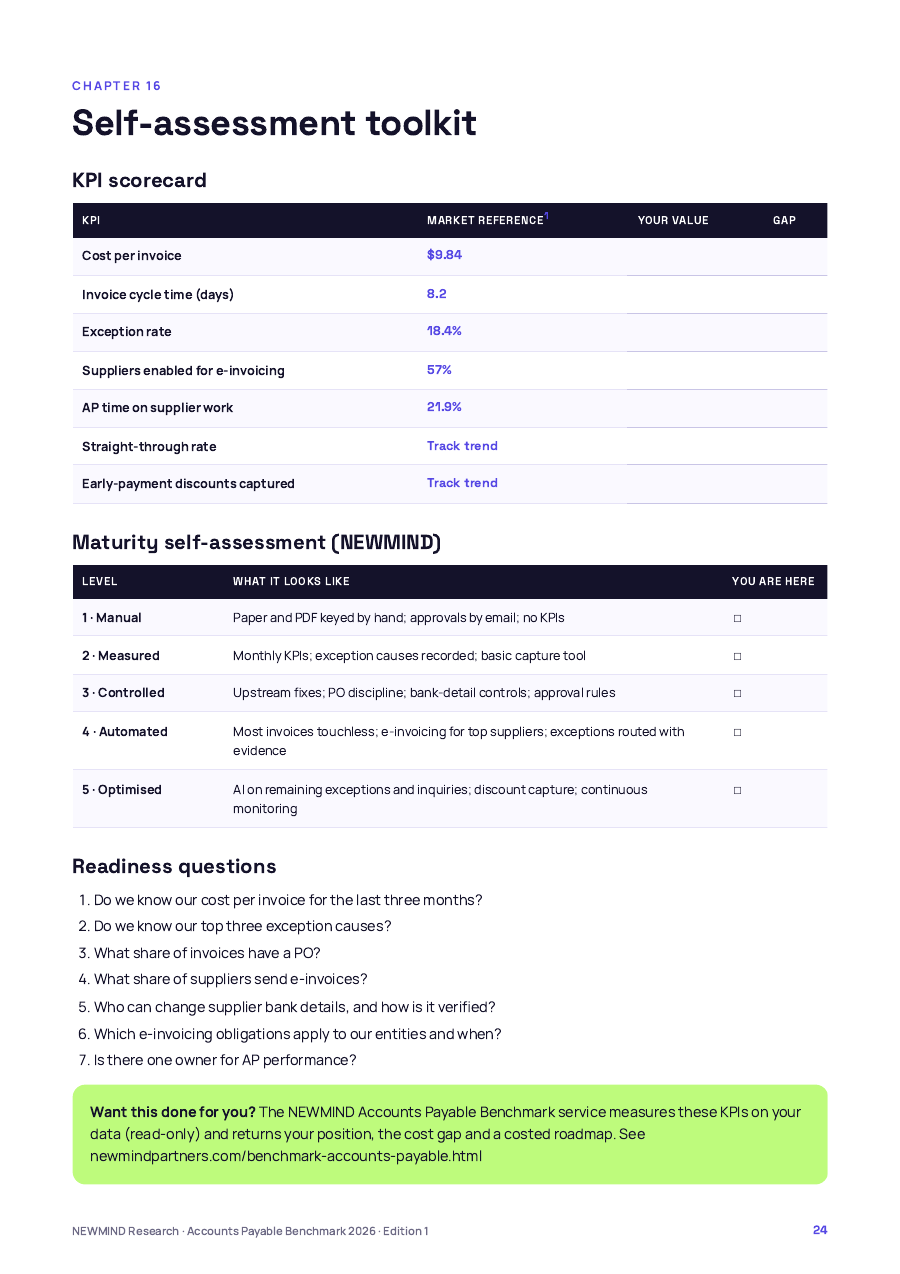
- KPI scorecard
- Maturity self-assessment
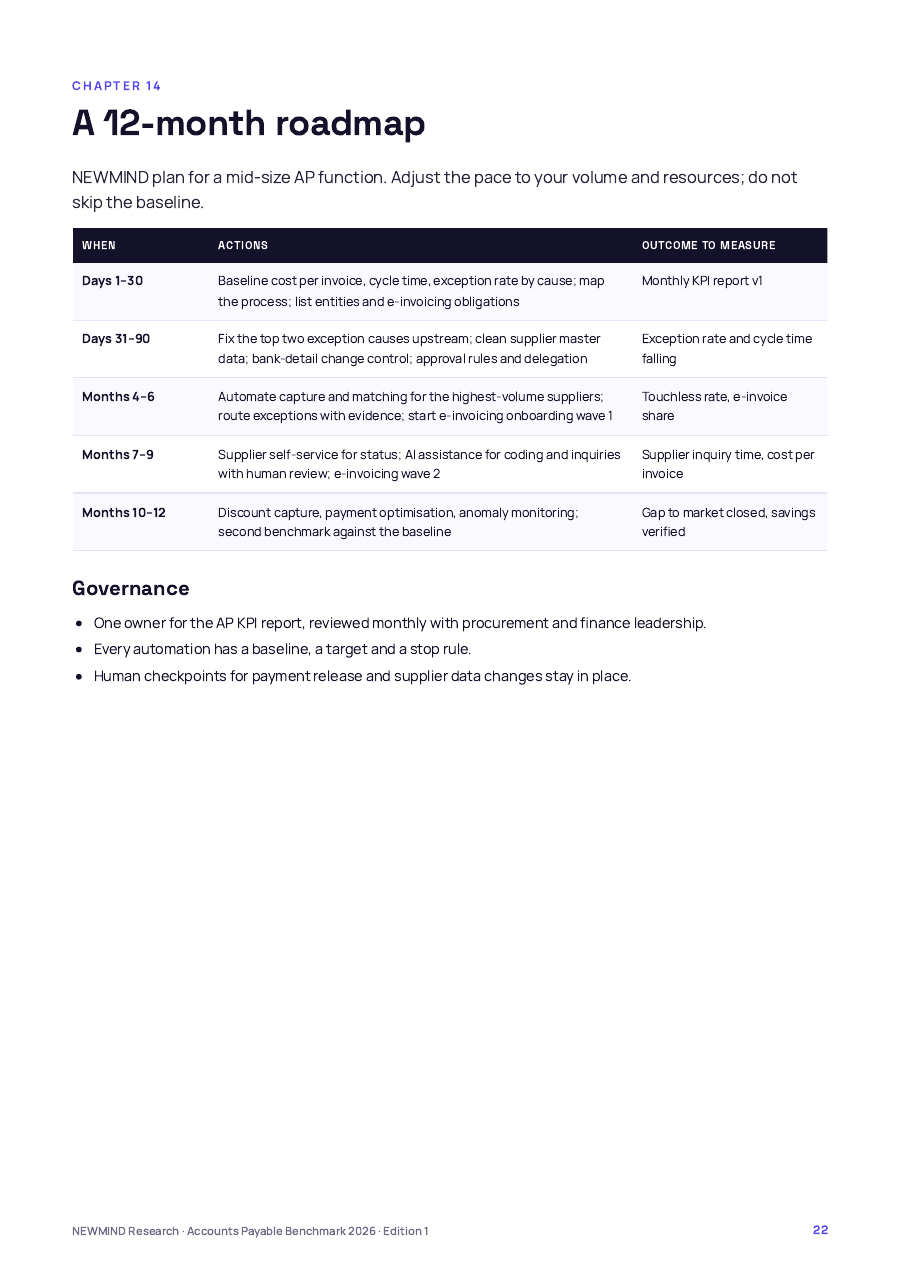
- 12-month roadmap
- Vendor question list
About this edition: built from published research and NEWMIND models. It does not yet include our own survey; Edition 2 adds survey data from decision-makers, free for Edition 1 buyers.
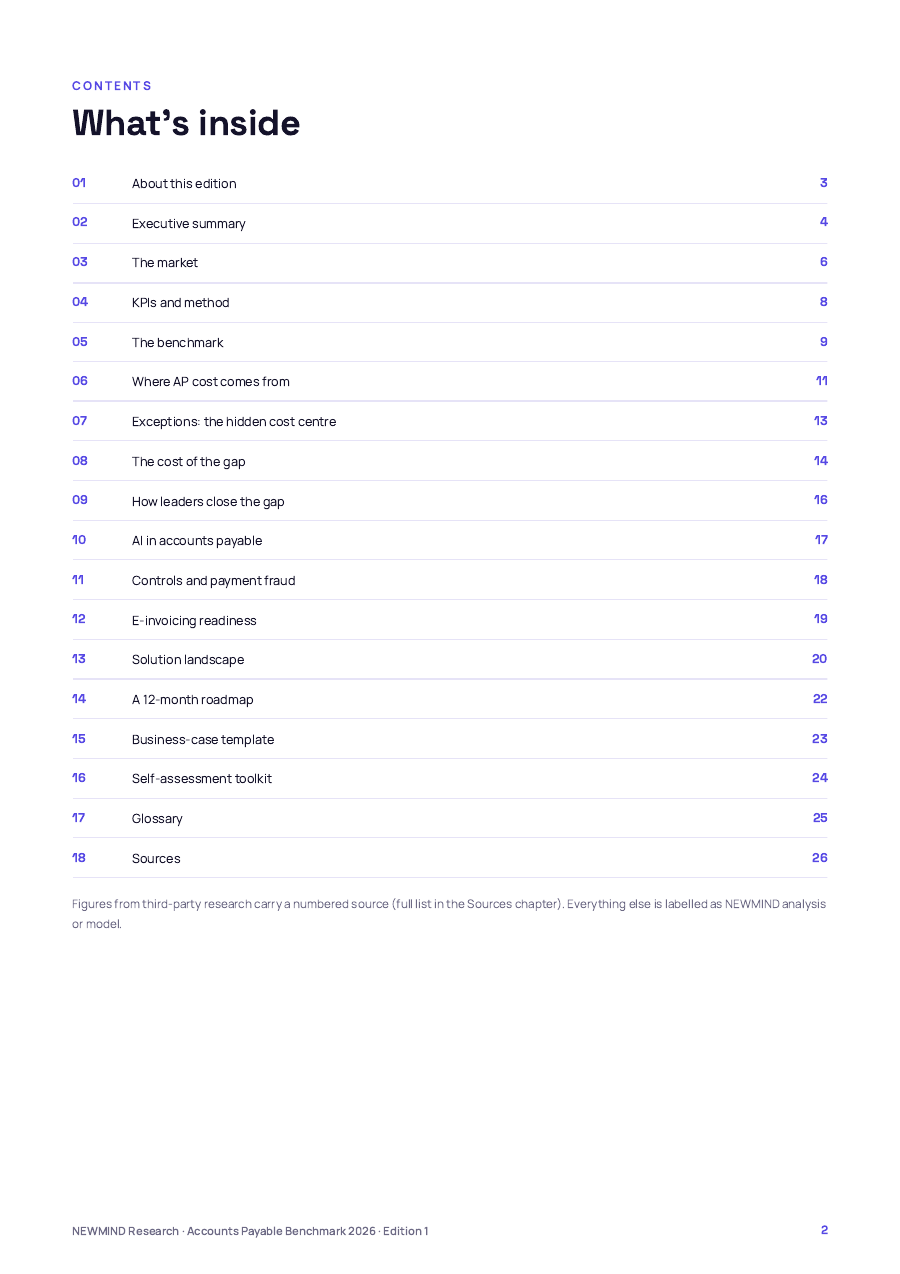
Contents
- 01About this editionp. 3
- 02Executive summaryp. 4
- 03The marketp. 6
- 04KPIs and methodp. 8
- 05The benchmarkp. 9
- 06Where AP cost comes fromp. 11
- 07Exceptions: the hidden cost centrep. 13
- 08The cost of the gapp. 14
- 09How leaders close the gapp. 16
- 10AI in accounts payablep. 17
- 11Controls and payment fraudp. 18
- 12E-invoicing readinessp. 19
- 13Solution landscapep. 20
- 14A 12-month roadmapp. 22
- 15Business-case templatep. 23
- 16Self-assessment toolkitp. 24
- 17Glossaryp. 25
- 18Sourcesp. 26
Read the executive summary first.
Cover, contents, about this edition and the ten key findings. Tell us where to send it and download it straight away.
Four steps. No disruption.
Intake call
30 minutes with a senior engineer to agree scope, KPIs and the data we need.
Data, read-only
Exports or read-only access to the systems involved. Nothing is changed.
Analysis
Your numbers placed against the published market references, KPI by KPI.
Readout
Your position, the cost gap in dollars and a costed roadmap to close it.
Reserve this report.
Reserve the accounts payable industry report, or ask for a custom benchmark on your own data.
- Your position vs market average and best-in-class on every KPI
- Cost gap in dollars per year, per KPI
- Root causes of your top three exception types
Sources
- 1Ardent Partners, The State of ePayables 2025 — “Part Nine: AP Benchmarks and Best-in-Class Performance” (22 Jan 2026). payablesplace.ardentpartners.com/2026/01/state-of-epayables-part-nine-ap-benchmarks-and-best-in-class-performance/
- 2Future Market Insights, Accounts Payable Automation Market (USD 3.4B in 2025, 10.3% CAGR). futuremarketinsights.com/reports/accounts-payable-automation-market
- 3Custom Market Insights, Accounts Payable Automation Market (USD 5.7B in 2025, 14% CAGR). custommarketinsights.com/report/accounts-payable-automation-market/